Post-trade and pre-trade limits in Portfolio window
The Limits tab in the Portfolio window allows you to see the limit definitions linked to your portfolio for the post-trade, pre-trade analysis and for the investment plan analysis. You can see date and the result of the last limit analysis.
Post-trade limits
Post-trade limit analysis checks your portfolio’s current positions and cash amount.
Pre-trade limits
Pre-trade limits analysis takes into account:
Current positions and cash you have in your portfolio at the moment of the analysis.
Effect of outstanding trade orders with statuses Accepted, Executable, Sent to execution, In execution, Partially executed in the market, Executed in the market and Settled in the market. The effect of outstanding trade orders is taken into account the following way on positions, cash and total market value based on trade order's transaction type's effects:
Positions - the amount of your outstanding trade order is used to calculate the expected market value of your position using the latest available market price as "(current amount +/- trade orders's amount) * latest market price = expected market value".
Cash - the trade amount of your outstanding trade order is used to calculate the expected cash balance as "current cash balance +/- trade order's trade amount = expected cash balance". If your trade orders are linked to an account, the trade order affects the linked account's expected balance. However, if your trade orders are not linked to an account, the trade order affects total cash balance and portfolio total.
Total market value - calculated as "expected market value of positions + expected cash balance".
Note
Trade order's effect on position is calculated based on the latest available valuation, i.e. the latest available market price, while trade order's effect on cash is calculated based on the information recorded on the trade order. Thus, a trade order's effect on position and cash might be different depending on the values the trade order has been entered into the system.
Example:
You have a trade order to buy 100 units of Instrument X at the price of 4 € per share. The amount of your order is 100, and the trade amount of your order is 100 * 4 € = 400 €. The latest market price of Instrument X is 4,1 € per share.
Effect on position:
The amount of your trade order and latest market price are used to calculate the position's expected market value. A "buy" increases amount, your trade order's amount was 100, and the latest market price is 4,1 € => trade order's effect on position's market value is 100 * 4,1 € = +410 €.
Effect on cash:
The trade amount of your trade order is used to calculate the expected cash. A "buy" has a negative cash effect, and your trade order's trade amount is 400 € => trade order's effect on cash is -400 €.
In addition, pre-trade limit analysis takes into account the following conditions:
Buying a security by specifying only a lump sum for the trade amount.
Pre-trade limit analysis supports a scenario when the customer wishes to "buy Instrument X with 1000€". Such a trade order is recorded in FA as 1000 as both the amount and trade amount, with unit price 1. For pre-trade limit analysis, the system will first calculate the expected amount based on latest available market price (1000 € / x €), and use that expected amount to calculate the expected position.
Pre-paid orders
Pre-trade limit analysis takes into account pre-paid orders - pre-paid orders already have a cash effect on your portfolio's cash balance, so they don't have an effect on expected cash, only on the expected position.
Limits and subportfolios
Limits you have defined on a portfolio take into account the contents of sub-portfolios - monitoring limits on the main portfolio level aggregates the main portfolio and all subportfolios' contents together. This allows you to very flexibly decide the "level" you want to perform limit analysis on - you can either monitor each portfolio separately, or build a sub-portfolio structure to aggregate different portfolios together to be monitored against a common threshold. For example, if you want to monitor limits on the contact level for a contact with multiple portfolios, define a main portfolio below your contact with the limits you want to use, and link all of your contact's portfolios as sub-portfolios to this main.
Analyzing limits
Analyzing limits for one portfolio. You can analyze all your portfolio's limits with the Analyze all limits button at the bottom of the Limits tab: This analyzes all limits linked to your portfolio on the current date. Alternatively, you can analyze post-trade limits, analyze pre-trade limits or analyze investment plan limits in corresponding tabs to only analyze limits on the selected level.
Mass-analyzing limits. You can mass-analyze multiple portfolios' limits at the same time through the Analyze limits button on the Portfolios view. This allows you to analyze all limits linked to your portfolios on the current date. Alternatively, you can analyze post-trade limits, analyze pre-trade limits or analyze investment plan limits to only analyze limits on the selected level. You can also automate limit analysis with extensions from FA AppStore: Automate limit analysis.
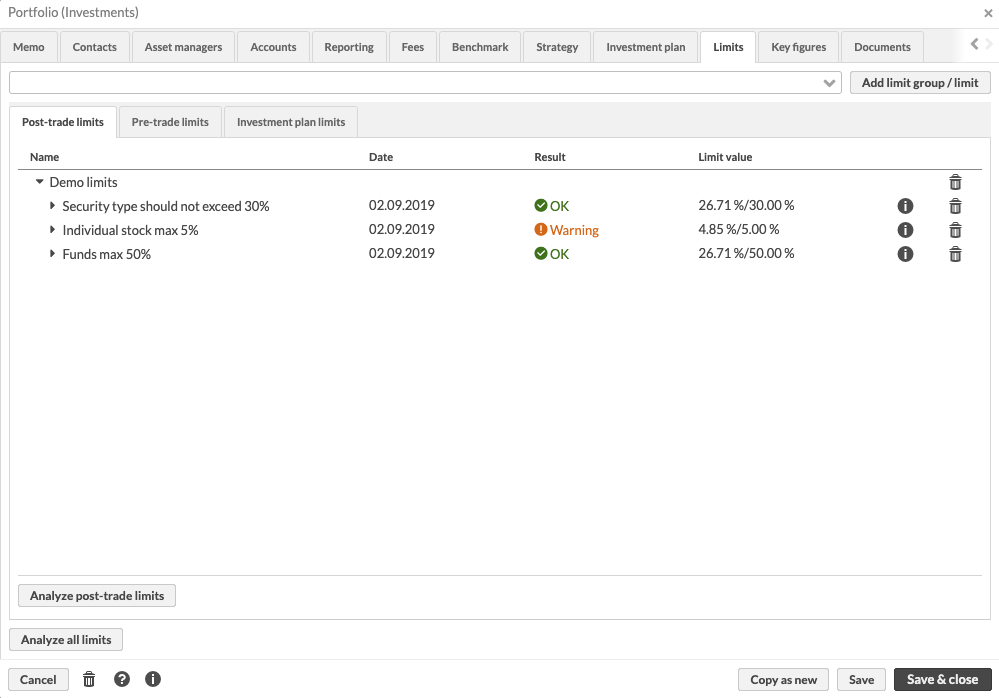
Results of limit analysis
The results of the limit analysis are broken down into columns:
- Name
A tree structure of limit group, each individual limit definition, and a break-down of the components of the limit definition analyzed while analyzing the limit.
- Date
The date the latest limit analysis is done. All limit values are based on the latest limit analysis, indicated with this date. If you want to see the results of prior analyses, click the Versions icon on the right for each limit.
- Result
The result of each limit after the limit analysis: a limit can either be OK, induce a Warning or be Breached. If your portfolio's contents are within the limit thresholds, the limit is reported as OK. If your portfolio's contents exceed the warning or breach thresholds, this is indicated in the limit result.
- Limit value
The value of the limit within the portfolio and the breach threshold value defined in the limit definition as Value in the portfolio / Breach threshold value. The limit value allows you to easily see which values the limit analysis compared to determine the result of your limit, and how far your portfolio is from the defined breach threshold.
- Versions

The history of the limit - this for example allows you to track the previous values and results of the limit during prior limit analyses, allowing you to track the value of the limit.
Details of a limit
Expand the tree to view the details below an individual limit. You can see which components were analyzed as part of the limit.
The details are relevant especially if your limit consists of multiple components that have been analyzed to determine the overall result of your limit. Consider the following examples:
Multiple values to analyze: For example, a limit of "Stock position's share in the portfolio cannot exceed 11%" needs to analyze every single stock position within your portfolio individually - if you have invested into more than one stock, and if any of the individual stock positions is over 11% (even if all other stock positions would be OK), the limit is breached. This is indicated in the details of a limit by listing all the individual stock positions within the portfolio, showing their result and value. This allows you to easily see the statuses of the individual components, in this example individual stock positions, and evaluate which ones of them contributed to the overall limit status and how.
One value to analyze: For example, a limit of "Total market value of Finnish stocks cannot exceed 10 000 €" only analyses one value, the total market value of Finnish stocks, as one entity - if this one value breaches the threshold, the limit is breached. This is indicated in the details of a limit by showing only one row, with no additional information compared to the overall limit definition.
Sum of values to analyze: For example, a limit "Share of Finnish stocks cannot exceed Swedish stocks" has been defined by summing up all Finnish stock positions together, and only analyses one value, the total market value of Finnish stocks, as one entity - if this one value breaches the threshold, the limit is breached. This is indicated in the details of a limit by showing only one row for "Total", with no additional information compared to the overall limit definition.
If your limit analysis consists of multiple components, the limit level result shows the result and values from "the worst" underlying component. If any of the components are breached, your limit is breached, or if there are no breaches, but any of the components induce a warning, the limit induces a warning, etc. The limit value on the limit level always picks up the largest value from the underlying components, allowing you to easily see the largest breached value or the value closest to the next threshold.